- Home
- Table in APA Format
- Regression Table Examples
Regression Table in APA Format
A regression table in APA format presents the results of a regression analysis clearly and without unnecessary detail.
This page provides examples of:
- a simple linear regression table
- a multiple linear regression table
The examples concentrate on the content and format of the tables.
If you need an explanation of regression analysis or the terms used in the tables, see what is regression analysis.
Simple Linear Regression Table in APA Format
You want to determine whether the number of hours studied each week predicts the final examination score.
You have results for 80 students. Weekly study time is the predictor, and the final examination score out of 100 is the outcome.
The results shown in Figure 1 indicate that:
- a positive B value that indicates that the predicted examination score increases as weekly study time increases
- that for each additional hour studied, the predicted examination score is 3.81 points higher
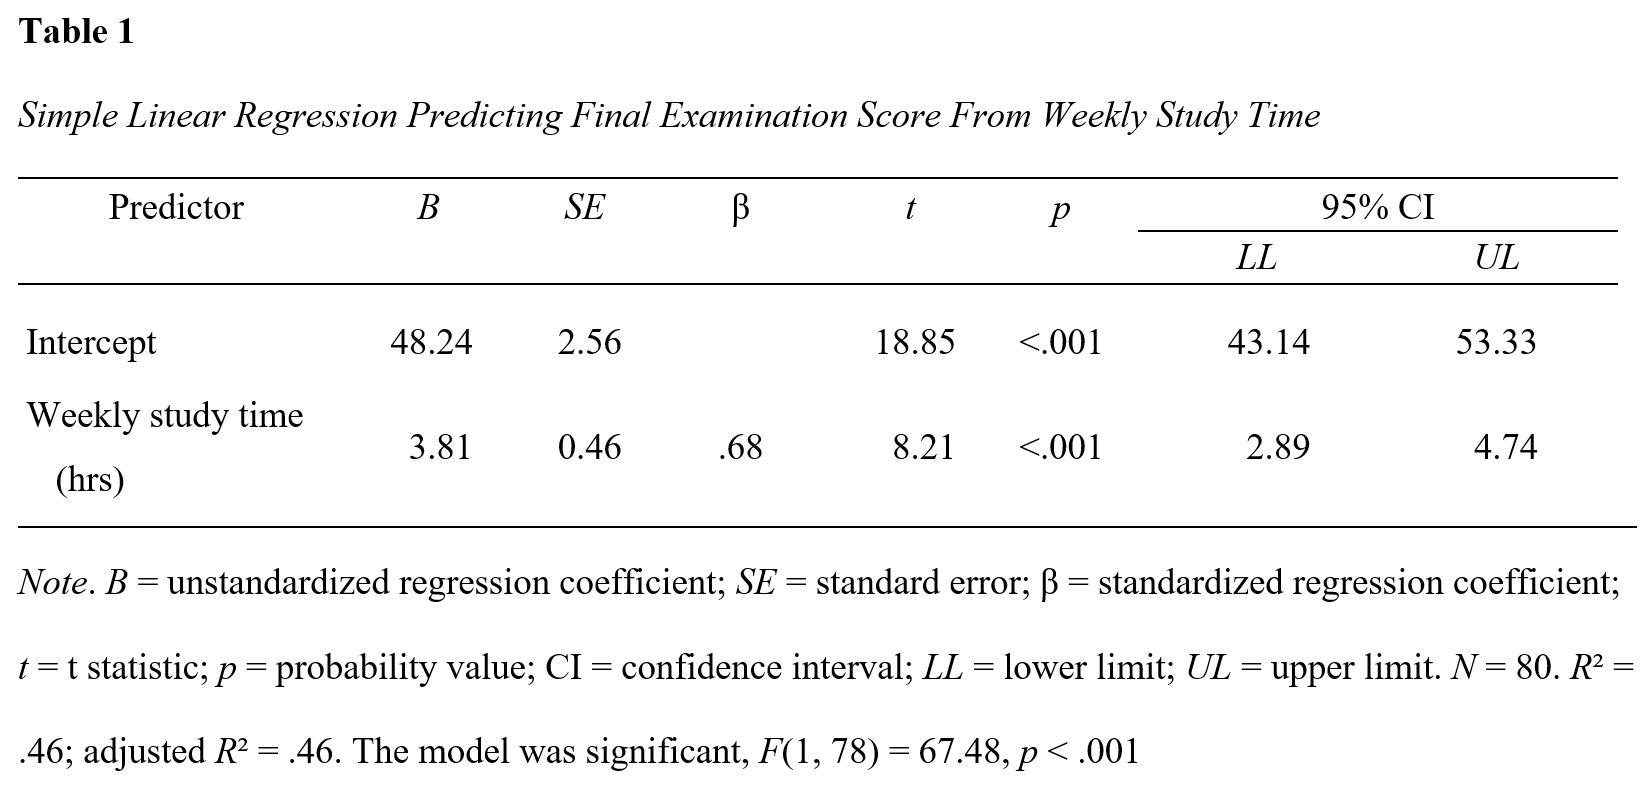 Figure 1: Example of a Simple Linear Regression Table in APA Format
Format the simple linear regression table as follows:
- Use bold for the table number, double spacing, and left-align it.
- Italicize the table title, write it in title case, use double spacing, and left-align it.
- Draw a horizontal line across the top of the table.
-
Center the column headings. Italicize statistical symbols.
Do not italicize the Greek letter β. - Draw a horizontal line below the spanner heading (95% CI) across only the columns it covers.
- Draw a horizontal line below the column headings across the full width of the table.
- Left-align the entries in the stub column (Predictor).
- Center the numeric table entries and align them on their decimal points.
- Draw a horizontal line across the bottom of the table.
- Do not use vertical lines.
- Double-space the general table note and place it below the table.
Italicize Note but not the text that follows.
Multiple Linear Regression Table in APA Format
You now want to determine whether weekly study time, attendance rate, and previous achievement predict the final examination score.
The coefficient for each predictor shows its relationship with the examination score after the other two predictors have been taken into account.
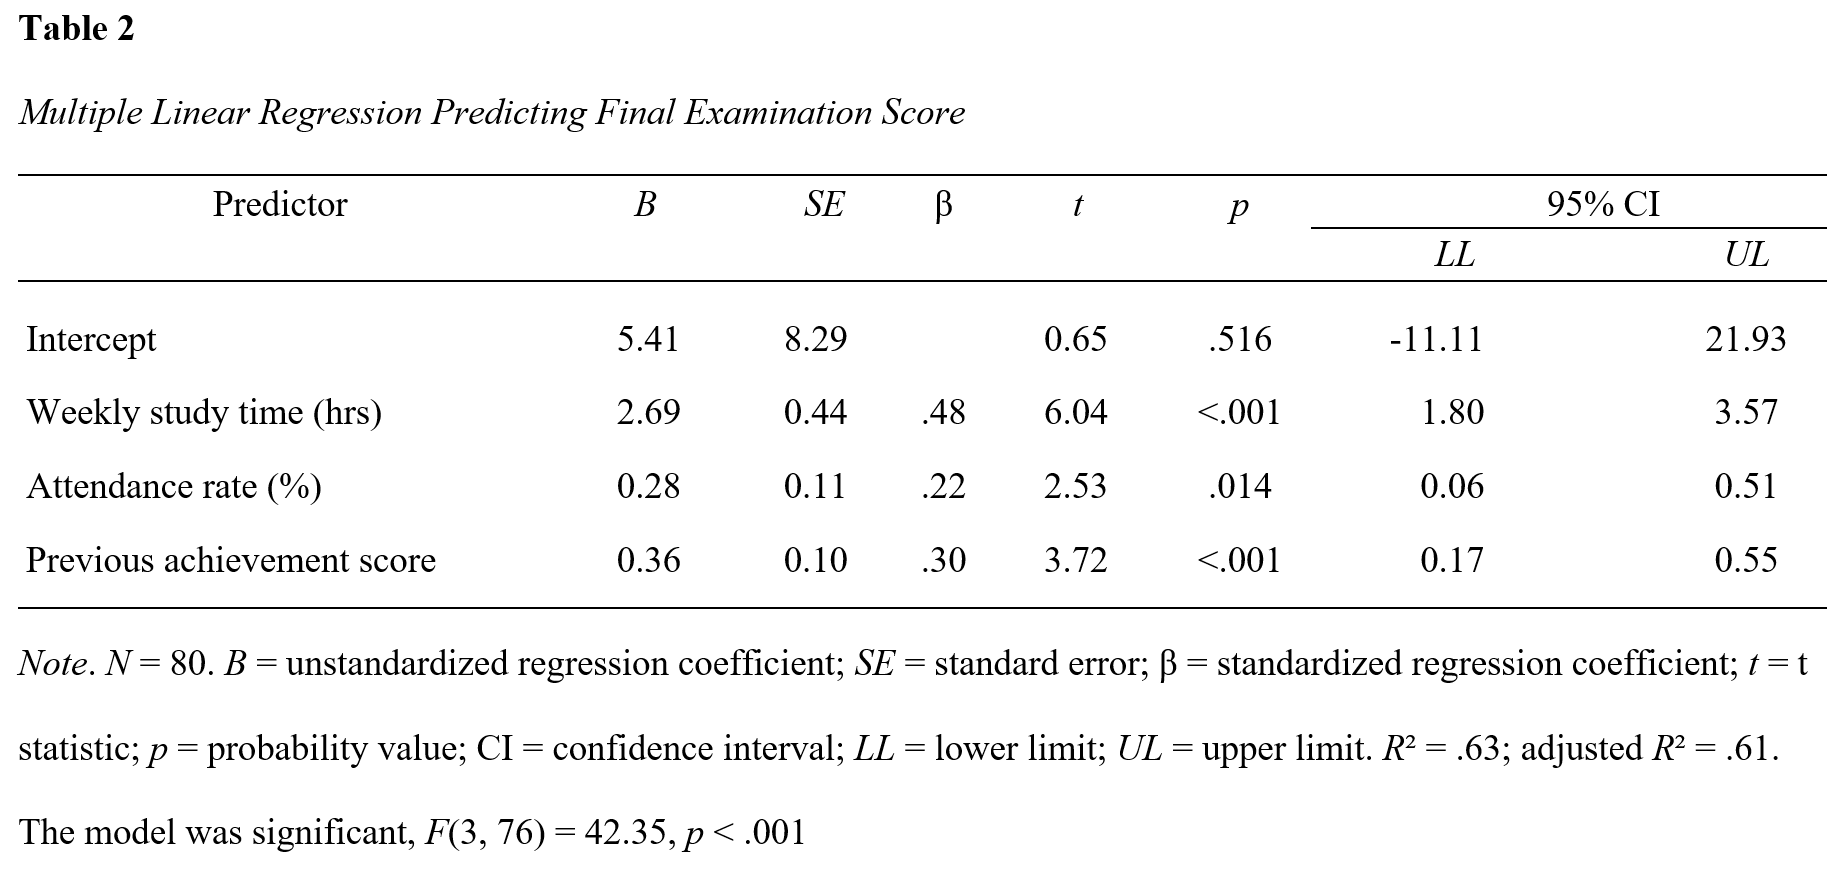 Figure 2: Example of a Multiple Linear Regression Table in APA Format
All three predictors have positive coefficients and p values below .05.
Weekly study time has the largest standardized coefficient (β = .48), followed by previous achievement (β = .30) and attendance rate (β = .22).
Together, the three predictors explain 63% of the variation in examination scores, as shown by R² = .63.
Format the multiple linear regression table as follows:
- Use bold for the table number, double spacing, and left-align it.
- Italicize the table title, write it in title case, use double spacing, and left-align it.
- Draw a horizontal line across the top of the table.
- Center the column headings. Italicize statistical symbols.
Do not italicize the Greek letter β. - Draw a horizontal line below the spanner heading (95% CI) across only the columns it covers.
- Draw a horizontal line below the column headings across the full width of the table.
- Align the stub (Predictor) entries to the left.
- Center the numeric table entries and align them on their decimal points.
- Draw a horizontal line across the bottom of the table.
- Do not use vertical lines.
- Double-space the general table note and place it below the table.
Italicize Note but not the text that follows.
Summary
A regression table in APA format should allow you to identify the predictors, examine their coefficients, and assess the overall model.
For both simple and multiple linear regression tables:
- use bold for the table number
- italicize the title
- use clear column headings
- left-align the predictor names
- center and decimal-align numerical entries
- use horizontal lines rather than vertical lines
- define unfamiliar abbreviations in a note below the table
A simple linear regression table contains one predictor.
A multiple linear regression table contains two or more predictors, with a separate row for each one.
See another example of a regression table in APA format.
Frequently Asked Questions
How do I add another predictor to a regression table in Word?
How do I add another predictor to a regression table in Word?
Click in the row above the position where you want the new predictor.
Select Table Layout > Insert Below. Add the predictor and its results to the new row.
Check the paragraph spacing and vertical alignment after adding the row because Word may not copy all the formatting consistently.
How do I align numbers on their decimal points?
How do I align numbers on their decimal points?
Select the numerical cells in the column and set a decimal tab stop using the ruler or the Tabs dialog box.
Place the cursor before each number and press Ctrl+Tab. In a Word table, pressing Tab by itself moves the cursor to the next cell.
Use the same decimal-tab position for every cell in the column.
How do I create a heading that covers two columns?
How do I create a heading that covers two columns?
Insert an additional heading row if necessary.
Select the two cells above the lower-limit and upper-limit columns, and then select Table Layout > Merge Cells.
Enter 95% CI in the merged cell and center the heading. Place LL and UL in the two cells directly below it.
How do I align all the entries vertically within a row?
How do I align all the entries vertically within a row?
Select the row and open Home > Paragraph.
Use the same line spacing throughout the row, and set the paragraph spacing before and after to 0 pt.
Then open Table Properties > Cell and set the vertical alignment to Center.
How do I remove the vertical lines from the table?
How do I remove the vertical lines from the table?
Select the table and open Table Design > Borders.
Remove all borders first if that is easier. Then add only:
- a line at the top of the table
- a line beneath the column headings
- a line at the bottom of the table.
Do not use vertical lines or a border around every cell.
How do I make the note the same width as the table?
How do I make the note the same width as the table?
Place the note in a separate paragraph immediately below the table.
Align its left edge with the table. Then use the right-indent marker on the ruler to align the end of the paragraph with the table’s right edge.
If the indent behaves unexpectedly, open the Paragraph dialog box and remove any negative right indent before setting the required positive indent.
What should I do if the regression table is too wide for the page?
What should I do if the regression table is too wide for the page?
First, adjust the column widths and allow long headings to wrap onto two lines.
If the table still does not fit, select Table Layout > AutoFit > AutoFit to Window.
For a particularly wide table, use a landscape page. Make sure the document section uses one text column, because a two-column setting can truncate the right side of the table.