- Home
- Table in APA Format
- Regression Table Examples
- Regression Analysis
What Is Regression Analysis?
Regression analysis is a statistical method used to examine relationships between variables.
Despite its technical name, its main purpose is usually quite simple.
Regression analysis helps you determine whether one or more variables can help predict an outcome.
A simple example
Imagine you want to determine whether the number of hours students study each week can help predict their final examination scores.
You collect information from 80 students. You record:
- the number of hours each student studies per week
- each student’s final examination score
In this example:
- weekly study time is the predictor
- final examination score is the outcome
The results are shown in Figure 1. Each point represents one student.
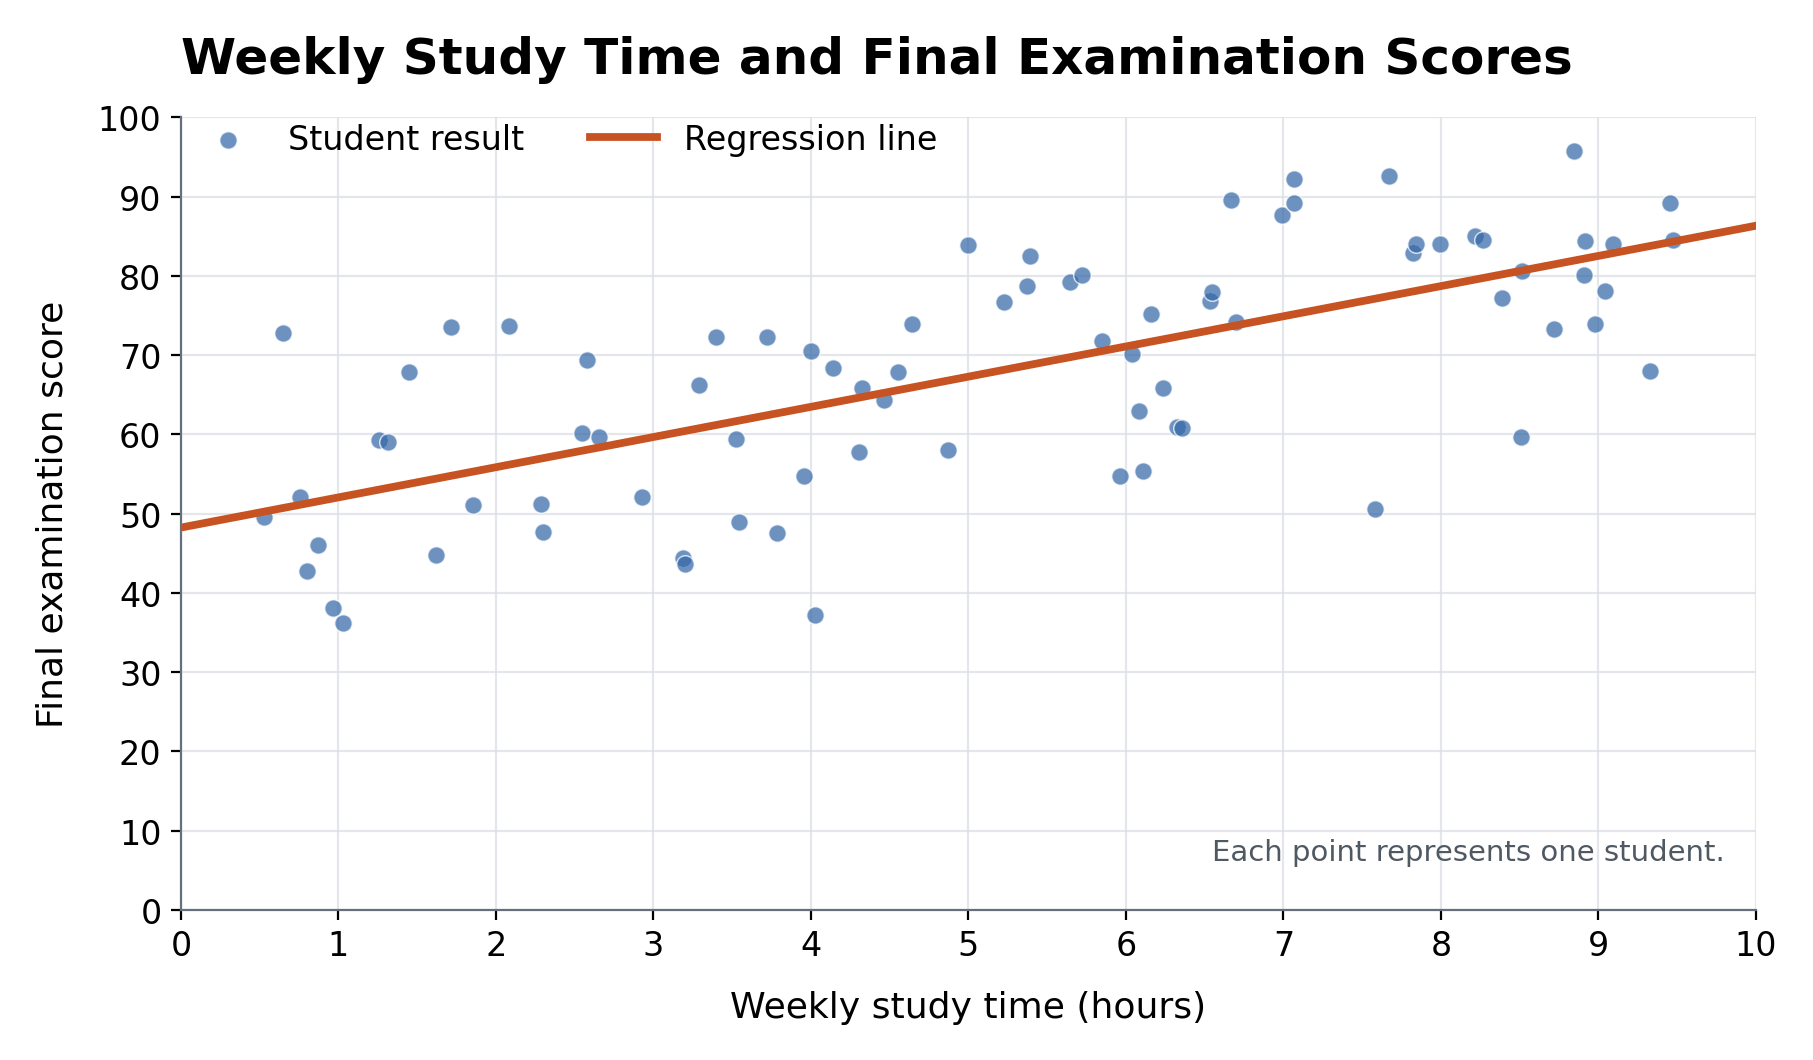 Figure 1: Weekly Study Time and Final Examination Scores
The points generally move upward from left to right. Students who study for more hours tend to receive higher examination scores.
At first, it may seem reasonable to conclude that weekly study time is related to examination performance.
However, the graph alone does not show the exact size of the relationship or how well study time predicts examination scores.
What Regression Analysis Enables You to See
Regression analysis enables you to see:
- whether the variables are related—weekly study time is significantly related to examination scores, p < .001
- the direction of the relationship—the positive coefficient shows that predicted examination scores increase as study time increases
- the estimated size of the relationship—each additional hour studied is associated with a predicted increase of 3.81 examination points
- the likely range of the relationship—the 95% confidence interval indicates an increase of between 2.89 and 4.74 points for each additional hour studied
- how much of the variation is explained—weekly study time explains 46% of the variation in examination scores, R² = .46
A regression table presents these results in a compact form.
Why Variation Matters
Students who study for the same number of hours will not necessarily receive the same examination score.
Their scores may also be affected by:
- previous achievement
- class attendance
- natural ability
- examination preparation
- health and other personal circumstances
This creates variation in the results.
Regression analysis determines whether there is a general relationship between study time and examination scores despite this variation.
It also measures how much of the variation can be explained by the predictor.
Predictor and Outcome Variables
Regression analysis distinguishes between predictor and outcome variables.
Predictor Variable
A predictor variable is used to predict or help explain an outcome.
Weekly study time is the predictor in the simple example.
Predictor variables are also sometimes called independent variables or explanatory variables.
Outcome Variable
The outcome variable is the result you want to predict or explain.
The final examination score is the outcome in the example.
The outcome variable is also sometimes called the dependent variable.
Simple Linear Regression
A simple linear regression uses:
- one predictor
- one numerical outcome
The study-time example is a simple linear regression because weekly study time is the only predictor.
The word linear means that the analysis represents the relationship using a straight line.
The individual results do not need to fall exactly on that line. The line represents the general pattern in the data.
In this example, the regression analysis estimates that each additional hour studied is associated with an increase of 3.81 points in the predicted examination score.
The Regression Coefficient
The regression coefficient shows the direction and estimated size of the relationship.
The unstandardized regression coefficient is represented by the statistical symbol B.
For weekly study time, B = 3.81.
The positive value shows that predicted examination scores increase as weekly study time increases.
The value 3.81 shows the estimated amount of that increase.
Therefore, if one student studies for one hour more per week than another student, the first student’s predicted examination score is 3.81 points higher.
This is an estimated relationship. It does not mean that every student who studies for one additional hour will gain exactly 3.81 points.
Positive and Negative Relationships
A regression coefficient can be positive or negative.
Positive Relationship
A positive coefficient means that the predicted outcome increases as the predictor increases.
In the study-time example, examination scores tend to increase as weekly study time increases.
Negative Relationship
A negative coefficient means that the predicted outcome decreases as the predictor increases.
For example, you might find that the number of examination errors decreases as weekly study time increases.
A coefficient close to zero indicates little or no linear relationship between the predictor and the outcome.
Statistical Significance
A regression analysis also helps you determine whether the relationship is statistically significant.
The p value provides evidence about whether the relationship is likely to exist beyond the students included in the analysis.
A result is commonly treated as statistically significant when p < .05.
For weekly study time, p < .001.
This provides strong statistical evidence that weekly study time is related to examination scores.
Statistical significance does not tell you whether the relationship is large or important. You also need to consider the coefficient and the circumstances in which the results will be used.
Confidence Interval
A confidence interval shows the range of plausible values for the regression coefficient.
The 95% confidence interval for weekly study time extends from 2.89 to 4.74.
This suggests that each additional hour studied is associated with a predicted increase of between 2.89 and 4.74 examination points.
The interval does not include zero. This supports the conclusion that weekly study time is related to examination scores.
A narrow confidence interval indicates a more precise estimate than a wide confidence interval.
How Much Variation Is Explained?
The statistical symbol R² shows how much of the variation in the outcome is explained by the regression model.
In the simple example, R² = .46
This means that weekly study time explains 46% of the variation in examination scores.
The remaining 54% is not explained by weekly study time. It may be associated with other variables or with natural differences between students.
An R² value of .46 does not mean that the model predicts each examination score with 46% accuracy.
Multiple Linear Regression
A multiple linear regression uses:
- two or more predictors
- one numerical outcome
You can extend the simple example by adding:
- attendance rate
- previous achievement
The multiple regression analysis now uses three predictors:
- weekly study time
- attendance rate
- previous achievement
Figure 2 shows the data collected from 80 students.
Each graph shows the relationship between one predictor and the final examination score, and each point represents one student.
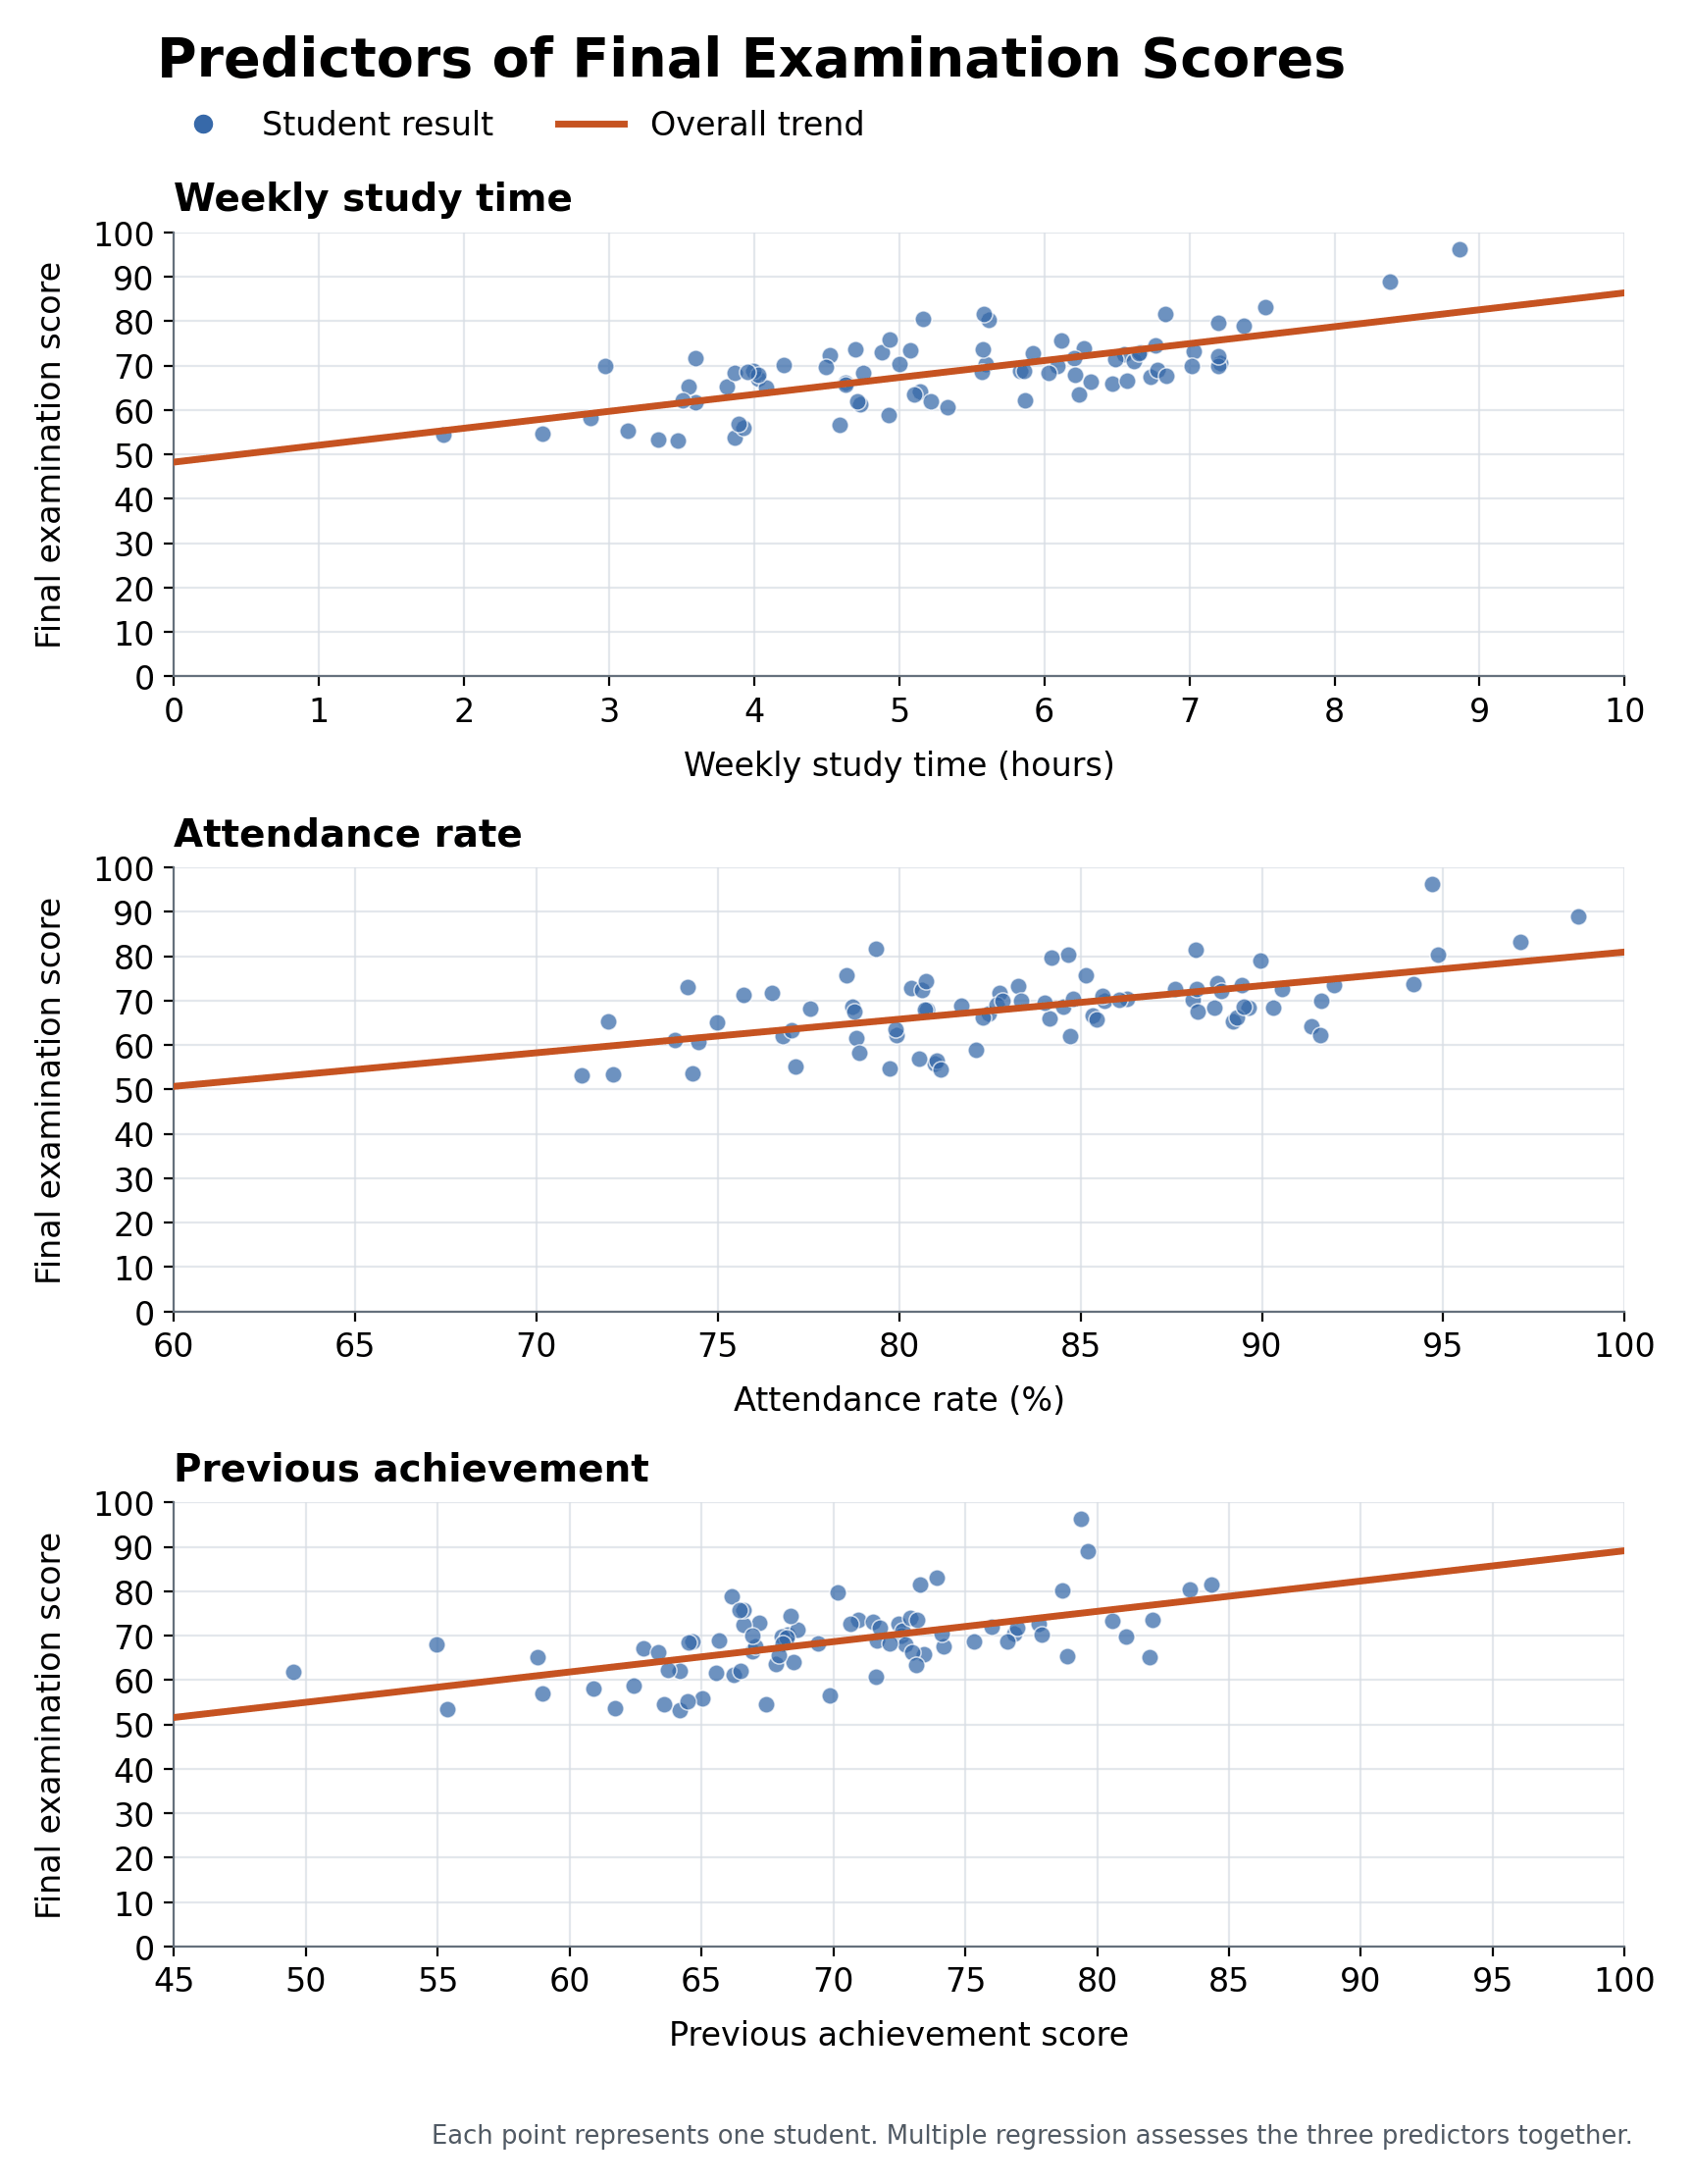 Figure 2: Predictors of Final Examination Scores
The outcome remains the final examination score.
The coefficient for each predictor shows its relationship with the examination score after the other predictors have been taken into account.
For example, the coefficient for weekly study time shows its relationship with examination scores after allowing for differences in attendance and previous achievement.
Comparing the Predictors
The standardized regression coefficient, β, can help you compare predictors measured using different units.
In the multiple regression example:
- weekly study time has β = .48
- previous achievement has β = .30
- attendance rate has β = .22
Weekly study time has the largest standardized coefficient. It therefore has the strongest relationship with examination scores in this model.
The size of β shows the relative strength of the relationship. The positive values show that higher values for all three predictors are associated with higher predicted examination scores.
Comparing the Two Models
Weekly study time alone explains 46% (R² = .46) of the variation in examination scores.
Weekly study time, attendance rate, and previous achievement together explain 63% (R² = .63).
Adding attendance and previous achievement therefore allows the multiple regression model to explain more of the variation in examination scores.
This does not necessarily mean that adding predictors will always improve a regression model in a useful way. Predictors should have a sensible reason for being included.
Information in a Regression Table
A regression table may include the following information.
Predictor
The Predictor column lists the variables used to predict the outcome.
The intercept is also usually shown in this column.
Intercept
The intercept is the predicted value of the outcome when all the predictors equal zero.
In the simple example, the intercept is 48.24. This is the predicted examination score when weekly study time is zero.
The intercept is part of the regression calculation, although it may not always have a useful practical meaning.
B
B is the unstandardized regression coefficient.
It shows how much the predicted outcome changes when the predictor increases by one unit.
SE
SE is the standard error.
It indicates the uncertainty surrounding the estimated coefficient. A smaller standard error generally indicates a more precise estimate.
β
β is the standardized regression coefficient.
It can help you compare the relative strength of predictors measured using different units.
t
The t statistic compares the estimated coefficient with its standard error.
A larger absolute t value generally provides stronger evidence that the coefficient differs from zero.
p
The p value helps you determine whether the relationship is statistically significant.
95% CI
The 95% confidence interval gives a range of plausible values for the coefficient.
LL identifies the lower limit, and UL identifies the upper limit.
R²
R² shows the proportion of variation in the outcome explained by the model.
Adjusted R²
Adjusted R² takes account of the number of predictors and the sample size.
It is particularly useful when you compare regression models containing different numbers of predictors.
F
The F statistic assesses the regression model as a whole.
It tests whether the model predicts the outcome better than a model containing no predictors.
Does Regression Prove Cause and Effect?
No. Regression analysis can show that variables are related, but it does not by itself prove that one variable causes another.
In the simple example, students who study for more hours tend to have higher predicted examination scores.
However, regression analysis alone does not prove that additional study caused the higher scores. Other variables may affect both study time and examination performance.
Describe regression results using expressions such as:
- is related to
- is associated with
- predicts
Avoid saying that one variable causes another unless the design of the study supports that conclusion.
Why Is It Called Regression?
The word regression can be misleading because it often means moving backward.
In statistics, it does not mean that the results are becoming worse or moving backward.
Regression analysis is the name given to a group of methods used to estimate relationships between variables and predict outcomes.
Calculating the Regression Results
In practice, statistical software performs these calculations. Programs such as IBM SPSS Statistics and the free alternative jamovi calculate the coefficients, standard errors, t and p values, confidence intervals and model statistics.
For examples showing how to present these results, see Regression Table in APA Format.
Summary
Regression analysis examines relationships between variables.
A simple linear regression uses one predictor and one numerical outcome.
A multiple linear regression uses two or more predictors and one numerical outcome.
Regression analysis helps you determine:
- whether predictors are related to the outcome
- whether the relationships are positive or negative
- the estimated size of each relationship
- whether the relationships are statistically significant
- how much variation in the outcome the model explains
A regression table presents these results in a compact form.
Regression analysis can identify relationships and make predictions, but it does not necessarily establish cause and effect.
Frequently Asked Questions
Is regression the same as correlation?
Is regression the same as correlation?
No. Correlation describes the strength and direction of a relationship between two variables.
Regression uses one or more variables to predict or help explain an outcome.
Can a regression analysis use more than one predictor?
Can a regression analysis use more than one predictor?
Yes. A simple regression uses one predictor, while a multiple regression uses two or more predictors.
What does a negative regression coefficient mean?
What does a negative regression coefficient mean?
A negative coefficient means that the predicted outcome decreases as the predictor increases.
Whether that decrease is desirable or undesirable depends on what the outcome measures.
What does R² = .46 mean?
What does R² = .46 mean?
It means that the regression model explains 46% of the variation in the outcome.
In the simple example, weekly study time explains 46% of the variation in examination scores.
Can regression analysis predict an exact result?
Can regression analysis predict an exact result?
No. Regression produces an estimate rather than a guaranteed result.
Two students who study for the same number of hours may still receive different examination scores because other factors also affect their performance.
Does regression analysis prove causation?
Does regression analysis prove causation?
No. Regression can show that variables are related, but it does not by itself prove that one variable causes another.
Are all regression analyses linear?
Are all regression analyses linear?
No. This page describes simple and multiple linear regression, which use a numerical outcome.
Other forms include logistic regression, which is commonly used when the outcome has categories, such as pass or fail.