- Home
- Table in APA Format
- Correlation Table Examples
Correlation Table in APA Format
A correlation table in APA format presents the relationships among two or more variables in a compact table.
Correlation tables commonly include the mean (M), standard deviation (SD), and correlation coefficients for each variable.
This page shows two examples.
The first is a simple correlation table with three variables.
The second shows a larger table that includes both positive and negative correlations.
For an explanation of correlation analysis and how to interpret correlation coefficients, see Correlation Analysis.
Simple Correlation Table in APA Format
Suppose a researcher collects data from 80 students to examine the relationships among:
- weekly study time
- class attendance
- final exam score
The results shown in Figure 1 indicate that:
- study time and exam score have a positive correlation of .68.
- attendance and exam score have a positive correlation of .45.
- study time and attendance have a positive correlation of .30.
- all three correlations are statistically significant at p < .01.
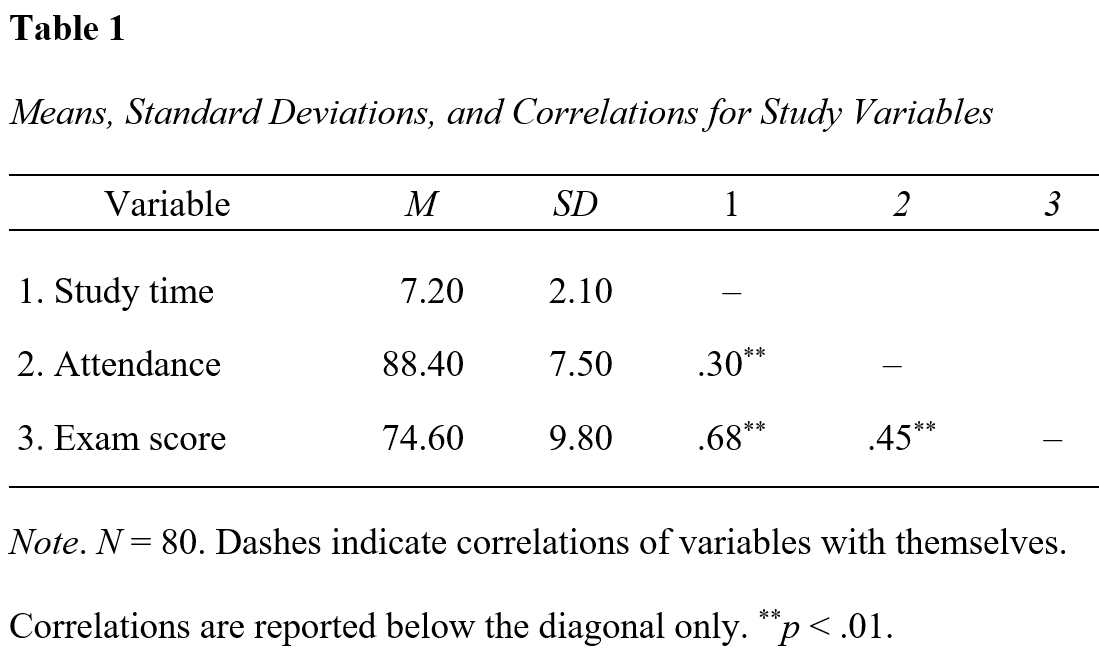 Figure 1: Correlations Among Study Time, Attendance, and Exam Score
Format the correlation table as follows:
- Use bold for the table number, double-space it, and left-align it.
- Italicize the table title, use title case, double-space it, and left-align it.
- Left-align the table on the page.
- Draw a horizontal line across the top of the table.
- Center the column headings. Italicize statistical symbols M (Mean) and SD (Standard Deviation).
- The numbers 1, 2, and 3 correspond to the numbered variables in the first column.
- Draw a horizontal line below the column headings across the full width of the table.
- Left-align the entries in the stub column (Variable).
- Do not include a zero before the decimal point for correlation coefficients because their values cannot exceed 1.00.
- Enter each correlation only once below the diagonal.
- Leave the corresponding cells above the diagonal blank.
- Use an em dash in the diagonal cells rather than reporting correlations of 1.00.
- Center the numeric table entries and align them on their decimal points.
- Draw a horizontal line across the bottom of the table.
- Do not use vertical lines.
- Double-space the general table note and place it below the table.
- Italicize the label Note but not the text that follows.
Larger Correlation Table in APA Format
Correlation tables are particularly useful when a study includes several variables.
Suppose you also collect the students' average nightly sleep and test anxiety.
The results shown in Figure 2 indicate that:
- study time and exam score have a positive correlation of .68.
- attendance and exam score have a positive correlation of .45.
- sleep and exam score have a positive correlation of .27.
- test anxiety and exam score have a negative correlation of −.58.
- some correlations, such as the correlation of .16 between study time and sleep, are not statistically significant.
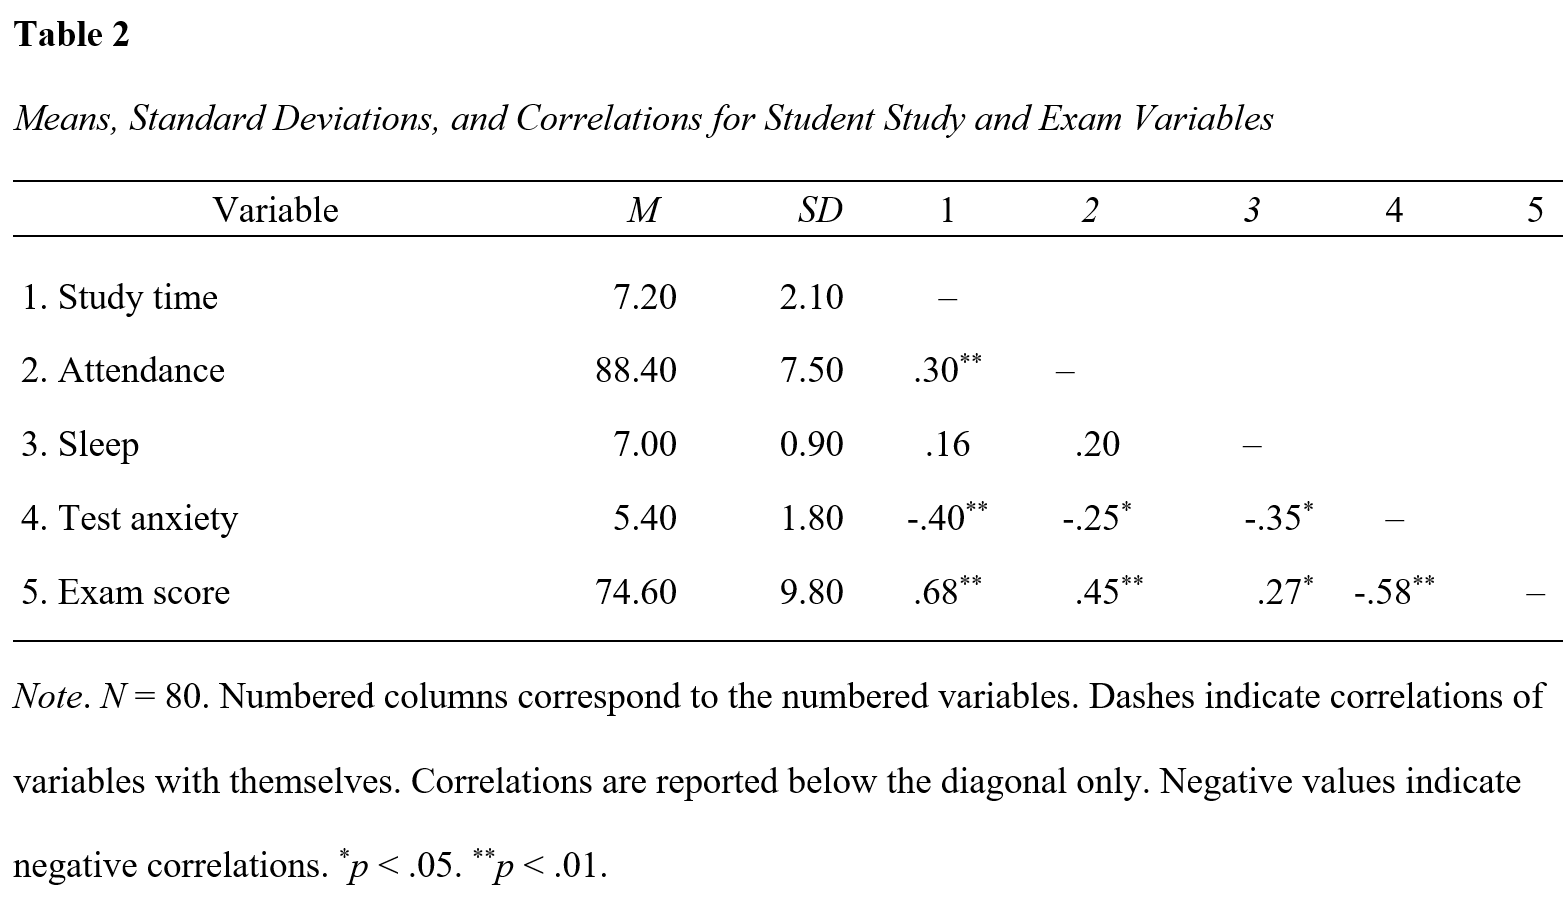 Figure 2: Correlations Among Five Student Study and Exam Variables
Use the same APA formatting as for the simple correlation table.
The main challenge is fitting the additional columns into the available space while keeping the table easy to read.
Avoid reducing the font size simply to fit a large table on the page unless this is necessary. Adjust the column widths first.
If the table becomes too wide for portrait orientation, consider whether landscape orientation would make the table easier to read.
Keep the Variable column wide enough for the variable names.
Format the correlation table as follows:
- Use bold for the table number, double-space it, and left-align it.
- Italicize the table title, use title case, double-space it, and left-align it.
- Left-align the table on the page.
- Draw a horizontal line across the top of the table.
- Center the column headings. Italicize statistical symbols M (Mean) and SD (Standard Deviation).
- The numbers 1, 2, 3, 4, and 5 correspond to the numbered variables in the first column.
- Draw a horizontal line below the column headings across the full width of the table.
- Left-align the entries in the stub column (Variable).
- Do not include a zero before the decimal point for correlation coefficients because their values cannot exceed 1.00.
- Enter each correlation only once below the diagonal.
- Leave the corresponding cells above the diagonal blank.
- Use an em dash in the diagonal cells rather than reporting correlations of 1.00.
- Center the numeric table entries and align them on their decimal points.
- Draw a horizontal line across the bottom of the table.
- Do not use vertical lines.
- Double-space the general table note and place it below the table.
- Italicize the label Note but not the text that follows.
Statistical Symbols in a Correlation Table
Italicize statistical symbols such as:
- M — mean
- SD — standard deviation
- N — sample size
- p — probability value
- r — Pearson correlation coefficient when you refer to it in the text.
The numbered column headings are ordinary numbers and are not italicized.
Significance Symbols
Asterisks are commonly placed beside correlation coefficients to indicate statistical significance.
Examples from Figure 2 are .27* and .68**. Explain the symbols in a note below the table.
For Figure 2, the note states that *p < .05 and **p < .01.
Summary
A correlation table in APA format provides a compact way to present correlations among several variables.
Include clear variable names and, where appropriate, the mean and standard deviation for each variable.
Number the variables so that you can use short numbered headings for the correlation columns.
Report each correlation only once rather than duplicating the values in both halves of the table.
Use dashes on the diagonal, leave the unused half of the matrix blank, and explain significance symbols in a note below the table.
Use the standard APA table format: a bold table number, an italicized title in title case, minimal horizontal borders, no vertical borders, and clearly aligned numerical values.