What is ANOVA?
ANOVA stands for analysis of variance.
Despite its name, its main purpose is usually quite simple.
ANOVA helps you to decide whether the averages of several groups are genuinely different.
A simple example
Imagine you want to compare three ways of teaching spelling:
- Group A uses flashcards
- Group B uses an educational game
- Group C uses ordinary classroom exercises
After four weeks, the students take the same spelling test.
The average scores (see Figure 1) are:
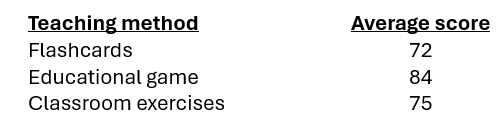 Figure 1: Average Spelling Scores for Three Teaching Methods
The educational-game group has the highest average score.
At first, it may seem reasonable to conclude that the educational game is the best teaching method.
However, the averages do not tell the whole story.
Students naturally differ from one another. Some may already be good at spelling. Others may find spelling difficult. Even students taught in exactly the same way will not all receive the same score.
ANOVA helps you decide whether the differences between the three group averages are large enough to be more than the differences that normally occur among individual students.
Why Does Variation Matter?
Suppose five students in the flashcard group score:
70, 71, 72, 73, 74
The scores are close together.
Now suppose another group has these scores:
52, 62, 72, 82, 92
Both groups have the same average score of 72, but the second group has much greater variation.
Variation describes how spread out the scores are.
ANOVA compares two kinds of variation:
- variation between the groups
- variation within the groups
Variation Between the Groups
The three group averages are:
- flashcards: 72
- educational game: 84
- classroom exercises: 75
These averages differ from one another.
ANOVA measures this as variation between the groups.
If the group averages are far apart, this between-group variation will be relatively large.
Variation Within the Groups
Students within the same group also receive different scores.
For example, students in the flashcard group might score:
65, 68, 70, 72, 75, 78, 80
These differences occur even though the students used the same teaching method.
ANOVA treats this as variation within the group.
This variation may be caused by differences in ability, effort, previous knowledge, or other individual characteristics.
What Does ANOVA Compare?
ANOVA compares the variation between the groups with the variation within the groups.
In simple terms:
- If the group averages are only slightly different compared with the variation among individual students, there may be little evidence that the teaching method made a difference.
- If the group averages are very different compared with the variation among individual students, there is stronger evidence that the teaching method made a difference.
This comparison produces a statistic called the F value.
The analysis also produces a p value, which helps decide whether the result is statistically significant.
A p value below .05 is commonly treated as statistically significant.
What Does a Significant Result Mean?
Suppose the ANOVA shows a statistically significant result.
You can conclude that there is evidence of a difference somewhere among the three teaching methods.
However, ANOVA does not automatically show which teaching methods differ.
For example, the difference might be between:
- flashcards and the educational game
- classroom exercises and the educational game
- flashcards and classroom exercises
- more than one of these comparisons
Further statistical tests may be needed to identify the particular groups that differ.
These are often called post hoc tests.
What Is a One-Way ANOVA?
A one-way ANOVA examines one factor.
In this example, the factor is teaching method.
It has three groups:
- flashcards
- educational game
- classroom exercises
You want to know whether spelling-test scores differ according to teaching method.
The term one-way refers to the number of factors being examined, not the number of groups.
A one-way ANOVA can compare two or more groups belonging to the same factor, although it is most commonly used when there are three or more groups.
What Is a Two-Way ANOVA?
A two-way ANOVA examines two factors at the same time.
Suppose you want to compare teaching method:
- flashcards
- educational game
- classroom exercises
and year level
- Year 5
- Year 6
You can now investigate three questions:
- Do spelling-test scores differ according to teaching method?
- Do spelling-test scores differ according to year level?
- Does the effect of the teaching method differ between Year 5 and Year 6 students?
The first two are called main effects.
The third is called an interaction.
An interaction occurs when the effect of one factor changes depending on another factor.
For example (see Figure 2) suppose the average scores are:
 Figure 2: Similar Teaching-Method Effects Across Year 5 and Year 6
The educational game performs well for both year levels. There may be little interaction between teaching method and year level.
Now suppose the results (see Figure 3) are:
 Figure 3: Possible Interaction Between Teaching Method and Year Level
The educational game now appears particularly effective for Year 5 students but not for Year 6 students.
This may indicate an interaction between teaching method and year level.
In other words, the effect of the teaching method depends on the year level.
What Information Appears in an ANOVA Table?
An ANOVA table summarizes the calculations used in the analysis.
Common statistical symbols include:
- SS — sum of squares
- df — degrees of freedom
- MS — mean square
- F — F statistic
- p — probability value
You do not need to calculate these values yourself to understand the basic purpose of ANOVA.
The important idea is that ANOVA compares the variation associated with the groups being studied with the variation that normally occurs within those groups.
Why Is It Called Analysis of Variance?
The name can seem confusing because ANOVA is often used to compare group averages.
However, ANOVA determines whether the averages differ by analysing the variation in the data.
It compares:
- variation between the groups
- variation within the groups
That comparison helps you decide whether the differences between the group averages are statistically significant.
Summary
ANOVA stands for analysis of variance.
It is used to compare the results of different groups or conditions.
A one-way ANOVA examines one factor. A two-way ANOVA examines two factors and can also test whether the two factors interact.
ANOVA works by comparing variation between groups with variation within groups. The resulting F and p values help you decide whether the differences are statistically significant.
ANOVA can show that a difference exists among groups, but further tests may be needed to identify exactly which groups differ.