- Home
- Table in APA Format
- ANOVA Table Examples
ANOVA Table in APA Format
An ANOVA table in APA format presents the results of an analysis of variance using the formatting required for an APA table.
A one-way ANOVA table shows the results for one factor.
A two-way ANOVA table shows the results for two factors and their possible interaction.
Both use the same general APA table format.
This page provides two examples:
- a one-way ANOVA table
- a two-way ANOVA table.
If you are not familiar with ANOVA (Analysis of Variance), see what ANOVA is.
One-Way ANOVA Table in APA Format
A one-way ANOVA compares results based on one factor.
For example, a researcher might compare the test scores of students taught using three different teaching methods (classroom, online, blended).
The ANOVA results can be presented in APA format as shown in Figure 1.
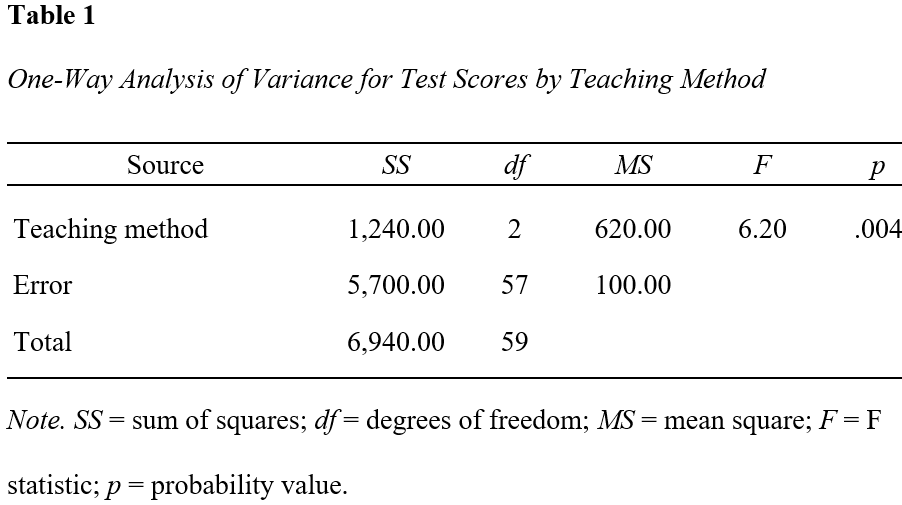 Figure 1: Example of a One-way ANOVA Table in APA Format
Use the following formatting for a one-way ANOVA table in APA format:
- Use bold for the table number, double spacing, and left-align it.
- Italicize the table title, write it in title case, use double spacing, and left-align it.
- Draw a horizontal line across the top of the table.
- Center the column headings, and keep them clear and concise. Italicize statistical symbols.
-
Draw a horizontal line below the column headings across the full width of the table.
- Align the stub (Source) entries to the left.
- Center the numeric table entries and align them on their decimal points.
- Draw a horizontal line across the bottom of the table.
- Do not use vertical lines.
-
Double-space the general table note and place it below the table.
Italicize Note but not the text that follows.
Two-Way ANOVA Table in APA Format
A two-way ANOVA compares results based on two factors.
For example, a researcher might compare the test scores of students taught using three different teaching methods (classroom, online, blended) across two year levels (Year 10, Year 11).
The ANOVA results can be presented in APA format as shown in Figure 2.
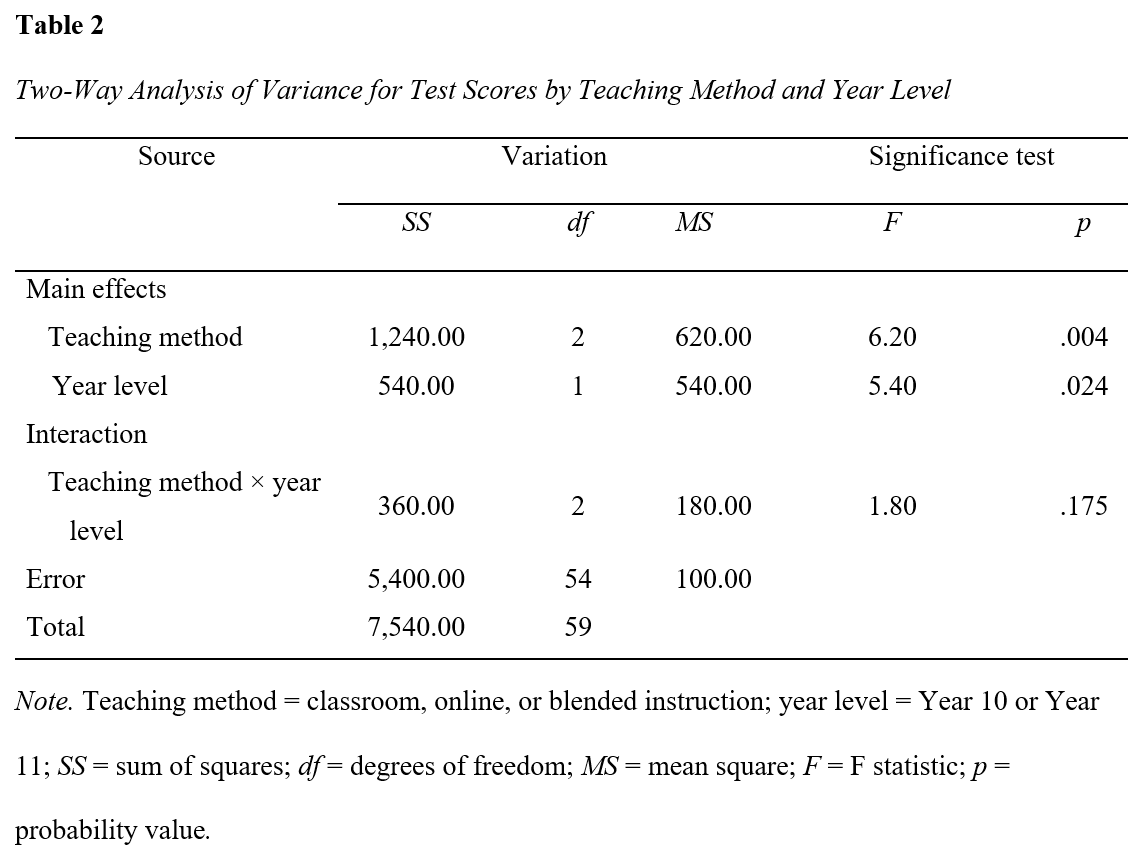 Figure 2: Example of a Two-way ANOVA Table in APA Format
Use the following formatting for a two-way ANOVA table in APA format:
- Use bold for the table number, double spacing, and left-align it.
- Italicize the table title, write it in title case, use double spacing, and left-align it.
- Left-align the table.
- Draw a horizontal line across the top of the table.
- Center the column headings. Use sentence case headings such as Source, Variation, and Significance test.
- Use spanner headings for related columns. Center Variation over SS, df, and MS, and center Significance test over F and p.
- Italicize the statistical symbols SS, df, MS, F, and p.
- Draw a horizontal line above each spanner heading across only the columns it covers.
- Draw a horizontal line below the column headings across the full width of the table.
- Align entries in the stub column to the left.
- Indent entries that belong under a category heading. Use the default Word tab.
- Align numerical values consistently. Where useful, align numbers on the decimal point.
- Do not use vertical lines.
- Draw a horizontal line across the bottom of the table.
-
Place the general table note below the table.
Italicize Note but not the text that follows.
Summary
An ANOVA table presents the results of an analysis of variance.
A one-way ANOVA table shows the results for one factor, while a two-way ANOVA table shows the results for two factors and their possible interaction.
Both use the same general APA table format. Use a bold table number, an italicized title in title case, clear column headings, appropriate horizontal lines, no vertical lines, and a general table note when needed.
Italicize statistical symbols such as SS, df, MS, F, and p.
Align stub entries to the left and align numerical values consistently, using decimal alignment where appropriate.
More complex ANOVA tables may also use spanner headings and indented subcategories in the stub column to organize the results clearly.
Frequently Asked Questions
How do I left-align a table in Word?
How do I left-align a table in Word?
Select the table, open Table Properties, and on the Table tab select Left under Alignment. Set the indent from the left to 0 if you want the table aligned with the page margin.
How far should I indent a subcategory in the stub column?
How far should I indent a subcategory in the stub column?
Use a small, consistent indent. About 0.15 in. (0.4 cm) is usually enough to show that the entry belongs under the category heading without pushing the text too far across the column.
What if an indented subcategory runs over two lines?
What if an indented subcategory runs over two lines?
Use a hanging-style alignment so the second line begins under the first line of the subcategory text, not back at the left edge of the stub column. This keeps the hierarchy clear.
How do I center a spanner heading over several columns?
How do I center a spanner heading over several columns?
Select the cells above the columns you want the heading to cover, merge those cells, and center the heading. For example, merge the three cells above SS, df, and MS for the spanner heading Variation.
How do I draw a horizontal line under only a spanner heading?
How do I draw a horizontal line under only a spanner heading?
Select the merged spanner cell and apply a bottom border. The border will extend only across the columns covered by that spanner.
How do I align numbers on the decimal point in Word?
How do I align numbers on the decimal point in Word?
Use a decimal tab stop in the numeric cells. The decimal tab aligns the decimal points even when the numbers contain different numbers of digits.
What if some cells in a numeric column are blank?
What if some cells in a numeric column are blank?
Leave them blank if the statistic does not apply. Do not insert zeros or dashes unless they have a specific meaning that you explain in the table note.
Should category headings such as “Main effects” be indented?
Should category headings such as “Main effects” be indented?
No. Align the category heading with the left edge of the stub column, then indent the entries that belong beneath it.